Benchmarking GPU Acceleration for ZK-Snarks
Mohamed Amine Kthiri

With Zero-Knowledge Proofs (ZKP) gaining more and more traction in recent years, interest in hardware acceleration for Zero-Knowledge Succinct Non-Interactive Argument of Knowledge (ZK-Snark) have risen significantly. While there have been a lot of research done on the hardware acceleration of Zero-Knowledge (ZK) primitives like MSM and NTT both on GPU and FPGA, the integration of those solution into full ZK-Snarks have been limited. Consequently, it has been difficult to properly assess the effect hardware acceleration would have on a full ZK-Snark's performance.
In this article, we look into the effect hardware acceleration on ZK-Snarks by benchmarking Icicle a library that does GPU acceleration for ZK primitives. Icicle provides wrappers in both Golang and RUST for the GPU-accelerated primitives so that developers can integrate them directly into their own ZK libraries. Our ZK library of choice is Gnark, written fully in Golang it is able to take advantage of the Icicle library. In this benchmark, we will study how GPU acceleration affects the performance of the ZK-Snark. We will also look at the economical viability of investing in hardware to accelerate ZK-Snarks using GPUs. The code we use for the benchmark is open-source and available on our github repo.
Benchmark
In our tests, we benchmarked the ZK-Snark by running it with and without GPU acceleration on a SHA256 circuit using 3 different curves: bn254, bls12-377 and bw6-761. We varied the pre-image size by setting to it 32 Bytes, 1 Kilobytes and 32 Kilobytes respectively. These benchmarks were ran on 2 testbenches and 6 GPUs in total. To sum it up, we ran 18 benchmarks per GPU: 3 curves / 3 pre-image sizes / with and without GPU acceleration. Each component of the benchmark is described in further details in the following paragraphs.
Hardware
One of the main goals of this benchmark is to figure out if it's worth the financial investment to use newer GPUs for ZK-Snark acceleration or just rely on older, cheaper ones. Therefore, we decided to run our benchmark on 2 testbenches: a high-end one and a low-end one. The specs for both machines are as follows:
- High-end:
- CPU: AMD Ryzen EPYC 7352
- GPU: RTX A5000 32GB (Ada version)
- RAM: 256GB DDR4
- Low-end:
- CPU: Intel Xeon E5-2650 V4
- GPU: GTX 1060, GTX 1070, Quadro M2000, Quadro K620
- RAM: 64GB DDR4
Since the version of Icicle we used does not have multi-GPU support, each GPU on the low-end testbench was benchmarked individually.
Curves
Icicle supports GPU acceleration for ZK primitives on 4 curves: bn254, bls12-377, bls12-381 and bw6-761. In our tests, bn254 and bls12-377 worked with no issues. GPU acceleration did not work on the bls12-381 curve. As a result, the effect of the GPU acceleration couldn't’t be measured when using that specific curve and that is why it was left out of the benchmark. bw6-761 also worked but it requires more memory than the other two curves. Hence why it failed in some tests with larger input sizes on the low-end testbench.
Circuit
We chose to run our benchmarks on a SHA256 circuit because it's interesting for some practical application in ZK-rollups. It is defined as follows:
- Inputs:
- Hash: 32 byte hexadecimal string (public)
- Pre-image: arbitrary size hexadecimal string (secret)
- Constraint: SHA256(Pre-image) == Hash
The SHA256 circuit handles the pre-image as an array of bytes with each byte being treated as an individual input. Therefore, a larger pre-image effectively means more inputs and subsequently more constraints, i.e a more complex circuit.
Benchmark flow
The flow of the benchmark consists of randomly generate 100 input pairs for the SHA256 circuit first. Then, we run the ZK-Snark for each of these input pairs while measuring the duration of each step as well as the GPU stats if it's being used.
The ZK-Snark we’re running uses the GROTH16 backend. The steps here as follows:
- Circuit Compilation: Turn the circuit into a R1CS constraint system
- Setup: Generate the public parameters, i.e the proving key and verifying key
- Witness generation: Generating a witness from the provided secret inputs for the proof
- Solution generation: Solving the constraint system, i.e Trace generation
- Proof generation
- Proof verification
Results
Notes
Before looking at the results of the benchmark, two important disclaimers need to be made.
First, the proofs generated when using GPU acceleration with the SHA256 circuit were invalid. In other words, we were able to generate the proofs but the proof verification step fails. This behavior was consistent irrespective of the curve used or the pre-image's size. The reason for this is unknown. We formulated two hypothesis and both can be refuted. The first hypothesis is that the circuit's implementation is bad. However, the same implementation produced valid proofs when running on CPU only. The second hypothesis is that the Icicle implementation is bad. But, we tested the ZK-Snark with two other circuits (see source code) and both generated valid proofs when running with GPU acceleration. We couldn't really come up with a definitive conclusion. But, given the fact that both the Icicle library and its integration into Gnark being experimental it is more likely that the fault lies within the Icicle code.
Second, we won't be considering the results from the low-end testbench. The main reason for this is that for the benchmarks that worked the runtime was worse with GPU acceleration than without it. This benchmark is meant to measure a trade-off between resources (hardware and energy) and performance (runtime). In the case of the low-end testbench, more resources did not result in better performance . Hence, those results are irrelevant for our analysis. We tried investigating the reason for this degradation in performance but it was simply beyond the scope of this work. Moreover, 2 of the 4 GPUs weren't able to even run any benchmark due to a lack of VRAM. Consequently, we will only be looking at the results for the high-end testbench.
Circuit Implementation & Setup
Circuit compilation and Setup are the first two steps of the ZK-Snark. Unlike the rest of the steps, they only need to be ran once (per circuit/curve combination). The runtimes for these two steps are depicted in table. Circuit compilation runtime depends only on the number of constraints which is depicted in table. while setup runtime depends on both the number of constraints and the curve used.
| Pre-image size | Number of constraints |
|---|---|
| 32 B | 153429 |
| 1 KB | 512545 |
| 32 KB | 11660821 |
| Pre-image size | Circuit compilation | Setup | ||||
|---|---|---|---|---|---|---|
| curve | bn254 | bls12-377 | bw6-761 | bn254 | bls12-377 | bw6-761 |
| 32 B | 1574 ms | 1519 ms | 1584 ms | 23 s | 39 s | 2 min 56 s |
| 1 KB | 4317 ms | 4420 ms | 4444 ms | 1 min 7 s | 1 min 57 s | 8 min 15 s |
| 32 KB | 82691 ms | 84706 ms | 86495 ms | 25 min 31 s | 43 min 58 s | 186 min 15 s |
Looking at the values in the table we can see that the amount of time the circuit compilation takes is insignificant when compared to that of the setup. We also notice that the setup duration increases with the size of the pre-image and with the size of the curve elements (bn254 → 254 bits / bls12-377 → 377 bits / bw6-761 → 761 bits). Since these two steps are independent of the inputs they can also be cached which would should lead to faster times. However, they would be ran only once in a practical scenario and that is why it is not that crucial.
ZK-Snark run
Each run of the ZK-Snark consists of 4 steps:
- Witness Generation
- Solution Generation
- Proof Generation
- Proof Verification
a) CPU only b) GPU accelerated
| Pre-image | size | Curve Witness Gen. | Solution Gen. | Proof Gen. | Proof Verif. | Full run |
|---|---|---|---|---|---|---|
| 32B | bn254 | 0 | 203.51 | 564.25 | 1 | 770.46 |
| bls12-377 | 0 | 204.05 | 875.17 | 3 | 1083.73 | |
| bw6-761 | 0 | 341.64 | 3886.05 | 12.02 | 4223.2 | |
| 1KB | bn254 | 2 | 722.69 | 1896.36 | 1 | 2624.07 |
| bls12-377 | 2 | 743.86 | 3192.36 | 3 | 3943.11 | |
| bw6-761 | 2 | 1248.74 | 11133.76 | 12.01 | 12398.18 | |
| 32KB | bn254 | 71.48 | 16031.46 | 48383.4 | 1.06 | 64489.51 |
| bls12-377 | 72.1 | 16733.58 | 79313.35 | 3.03 | 96124.15 | |
| bw6-761 | 72.58 | 28031.4 | 270904.65 | 12 | 299022.44 |
| Pre-image | size | Curve Witness Gen. | Solution Gen. | Proof Gen. | Proof Verif. | Full run |
|---|---|---|---|---|---|---|
| 32B | bn254 | 0 | 210.95 | 141.93 | 0.95 | 355.39 |
| bls12-377 | 0 | 210.29 | 202.71 | 3 | 417.39 | |
| bw6-761 | 0 | 331.05 | 531 | 11.98 | 875.02 | |
| 1KB | bn254 | 2 | 730.39 | 398.15 | 0.96 | 1133.44 |
| bls12-377 | 2 | 751.42 | 576.09 | 3 | 1334.29 | |
| bw6-761 | 2 | 1180.53 | 1559.72 | 11.9 | 2755.49 | |
| 32KB | bn254 | 72.59 | 16080.99 | 39009.16 | 1 | 55165.81 |
| bls12-377 | 72.61 | 16690.96 | 41402.2 | 3 | 58170.57 | |
| bw6-761 | 72.97 | 26072.86 | 72952.94 | 11.99 | 99112.18 |
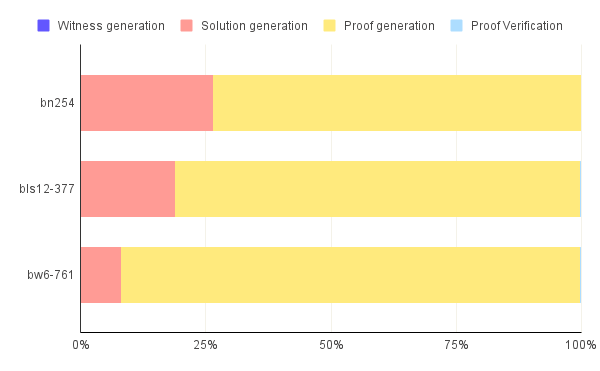
The results of the benchmarks are summarized in the table.3 . Out of the 4 steps, only Solution Generation and Proof Generation have a significant contribution to the ZK-Snark's runtime. In fact, Witness Generation and Proof Verification combined consist less than 1% of the runtime across all the benchmarks. Therefore, we can ignore them for the rest of this analysis. This is particularly evident in figure.1. This graph was generated for an pre-image size of 32 Bytes with no GPU acceleration. Other pre-iamge sizes show similar proportions.
GPU acceleration Speed-up
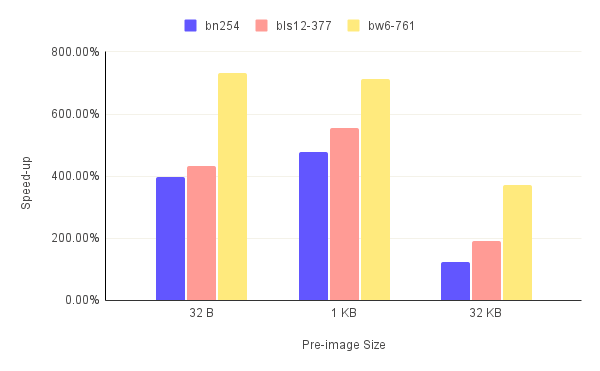
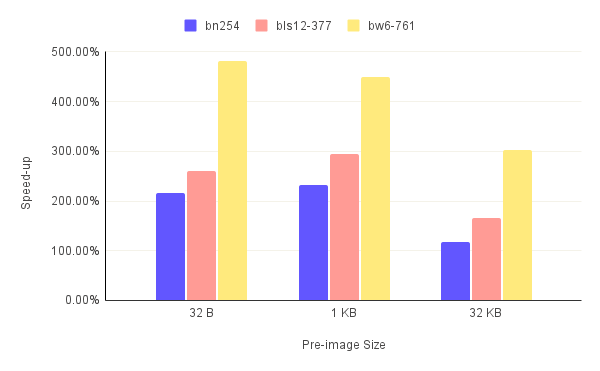
Using the GPU to accelerate the ZK primitives reduces the runtime of the proof generation and the full run overall. The speed-up numbers across all benchmarks are depicted in figures.3. Note that speed-up is calculated using the following formula:
.
Looking at the graphs, we notice a few things:
- The GPU acceleration produces a significantly larger speed-up for the bw6-761 curve compared to the bn254 and bls12-377 curves.
- The speed-up is anywhere from 124% to 713% for the proof generation and 116% to 496% for the full run.
- The speed-up is much smaller for the 32 KB pre-image compared to the smaller pre-images.
- Since the solution generation step is not GPU-accelerated, the full run speed-up is always smaller than that of the proof generation.
GPU stats
During the benchmark, we also kept track of the GPU stats when using GPU acceleration. More precisely, we kept track of the GPU utilization, memory utilization and power consumption. We measured the averages and peak values throughout each run for these 3 metrics. We also look at how all of these GPU metrics evolve throughout a single run. In addition, we calculate the energy consumption by integrating power consumption over time.
GPU Memory utilization
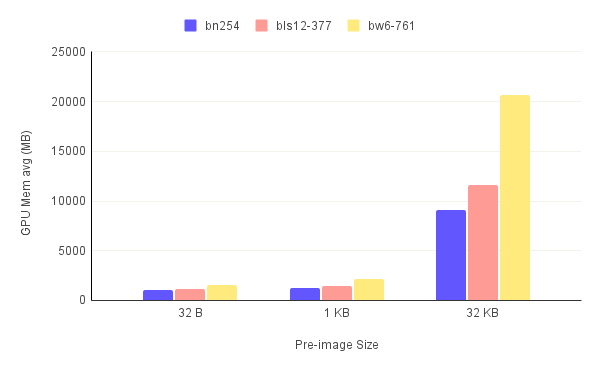
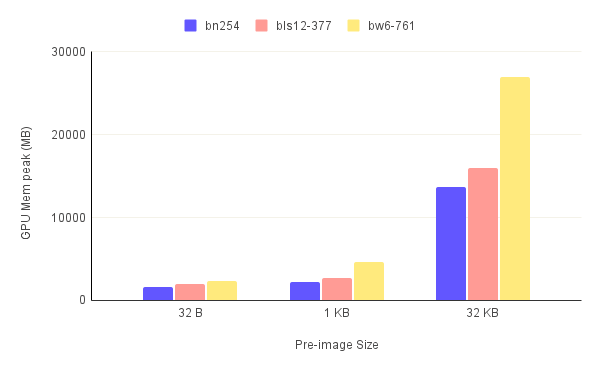
The first thing to notice when looking at figures.3 is the high memory utilization for the 32 KB pre-image compared to smaller pre-images. The trend of the bw6-761 being the most resource-intensive curve also continues here with it reaching an astounding almost 27 GB peak VRAM usage. This alone means that this circuit/curve combination can only be ran on select few consumer-grade GPUs. For the 32 B and 1 KB pre-images, we see that the memory requirements are heavily reduced ranging anywhere from 1.5 GB to almost 6 GB.
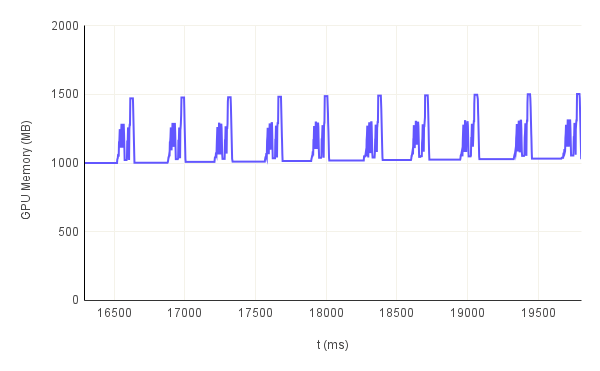
Looking at the evolution of memory utilization for 10 consecutive runs as depicted in figure.4, we can clearly see the cyclical nature of the graph. We also notice, that it always comes back to a sort of a baseline. This baseline represents the memory pre-allocated for the keys calculated during the setup step that were cached in the VRAM for quick access. This means that proof generation does not consume all the memory reported to be reserved, only a fraction of it. In this example, approximetally 1 GB is allocated for the keys while the proof generation only consumes around 0.5 GB. This is important for running multiple ZK-Snark instances concurrently with GPU acceleration as all the instances can share the pre-allocated keys. The GPU samples also confirm that this pre-allocated memory is more or less equal to the average GPU memory utilization. We also noticed that the memory utilization slightly increases after each run. This is indicative of a memory leak in the Icicle software.
GPU utilization
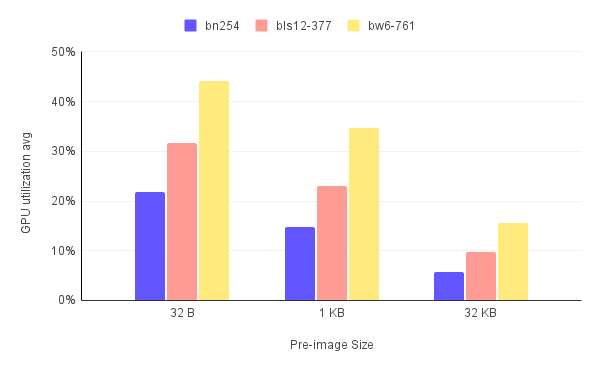
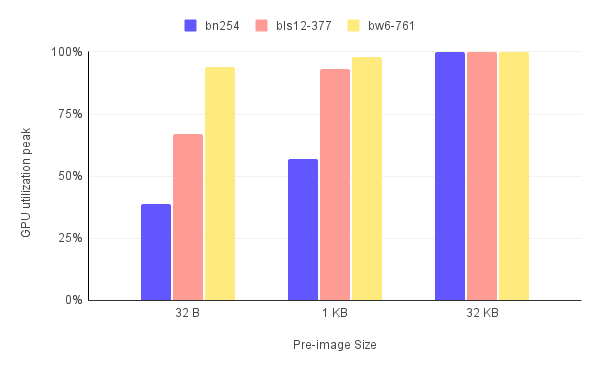
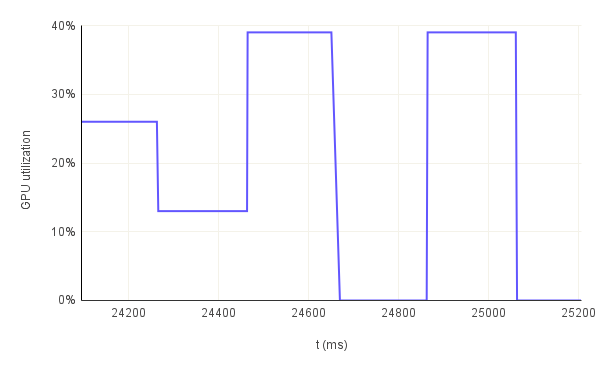
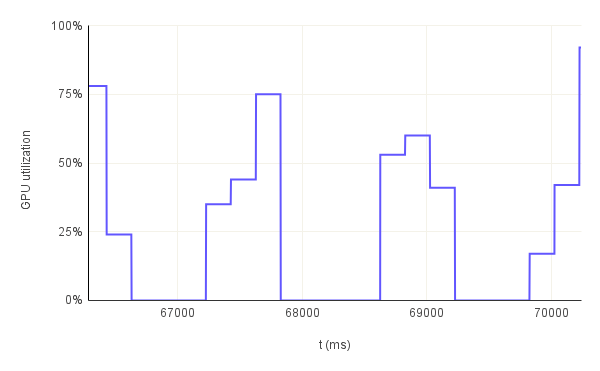
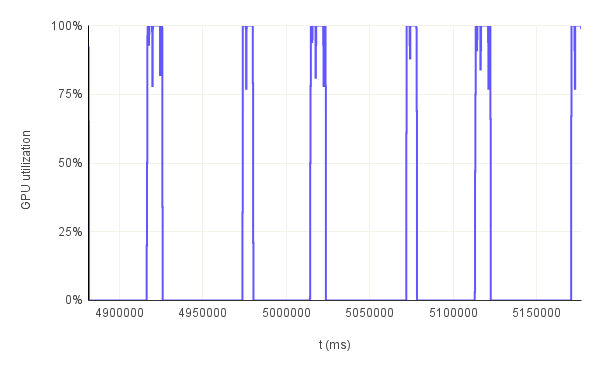
The graphs in figure.5 present a rather confusing image of the GPU utilization. On the one hand, the average GPU utilization is decreasing with increasing pre-image size. On the other hand, this trend is reversed for the GPU utilization peaks. The logical explanation is that the GPU is being used more intensely for larger pre-images but for shorter periods of time in proportion to the full run's duration.
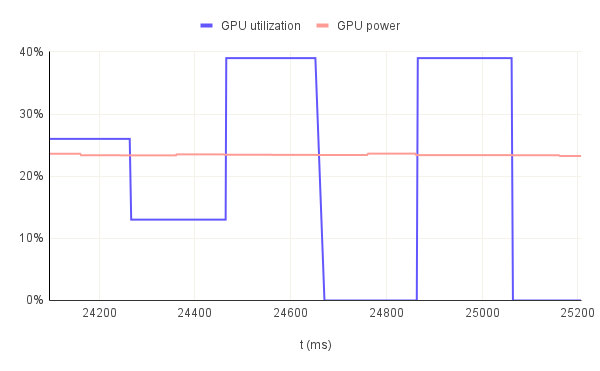
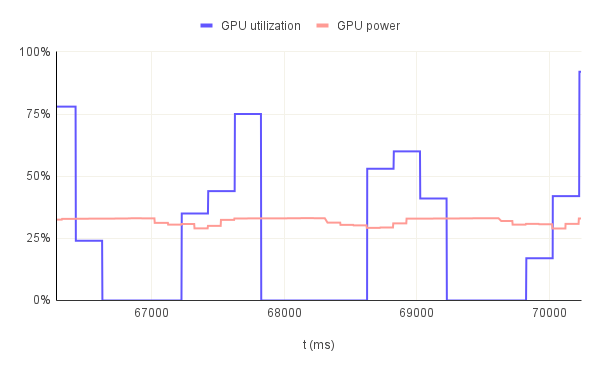
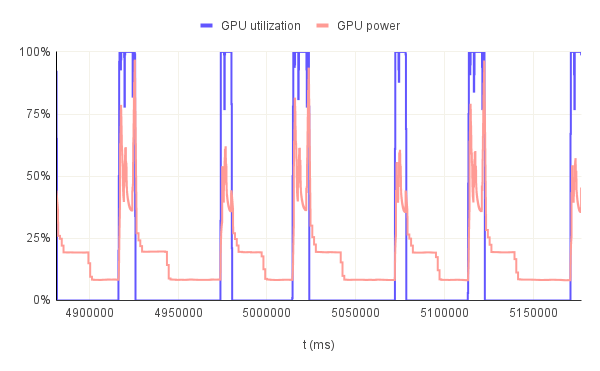
This hypothesis is further confirmed when we look at the GPU utilization throughout multiple consecutive runs. In figure.6, we have 3 examples: bn254 curve with 32B pre-image, bls12-377 curve wih 1KB pre-image and bw6-761 curve with 32KB pre-image all running for 3 consecutive runs. In the first example, the GPU utilization never goes to 0% between the first and second run. So, there are times when the GPU is not being really utilized practically but the resources are effectively allocated. Remember that the solution generation is not GPU accelerated. Therefore, in each run there should be a portion where the utilization is 0%. That is not the case here. The reason for this behavior is that the duration of the full run is so small that the allocated GPU resources cannot be freed and therefore they remain "utilized". However, for the other two examples with a longer full run duration we can see how the GPU is being utilized for a short period of time and then it goes back to 0% in a periodic manner. This especially evident in the third graph which has 2 peaks for each run further confirming the hypothesis that the GPU is not being utilized during the full duration of the proof generation step.
GPU power
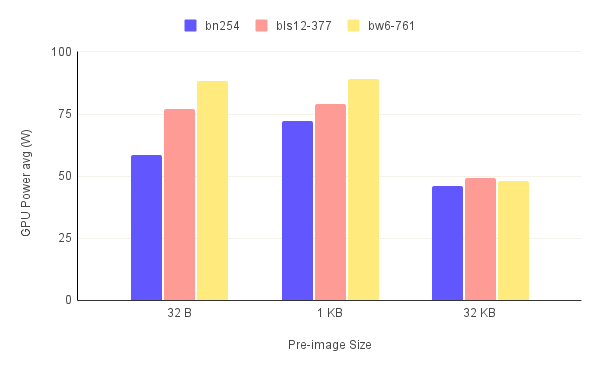
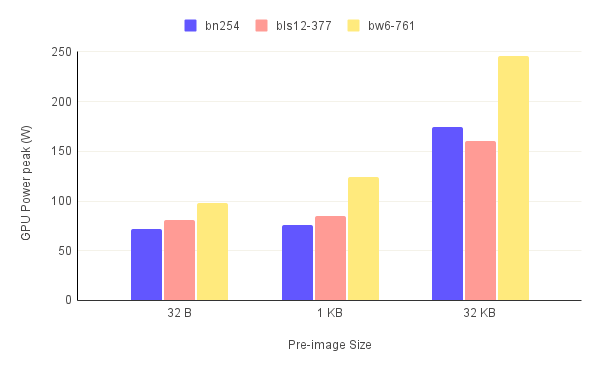
The graphs for power consumption averages and peaks depicted in figure.7 follow the same trend as those of the GPU utilization. This makes sense since GPU utilization and power consumption are strongly correlated.
If we look at the GPU utilization and power consumption on the same graph as depicted in figure.8 we can see that correlation very clearly. But we notice a strange behavior. For the first two graphs the power consumption remains somewhat constant although the utilization drops to 0% at times. In the third graph however, the power consumption drops down to idle levels after some time, 18.5 s on average to be exact. This value is probably specific to the used GPU but the concept should be valid for all Nvidia GPUs: the GPU consumes power more than its idle consumption even after all the resources are freed for a period of time and then drops back down. This is why in the first two graphs the power consumption never really drops. It's because the GPU did not have the time to drop its power consumption. Now, this behavior is somewhat problematic because it implies more power consumption and eventually a higher cost even when the GPU is not being fully used. Therefore, we can conclude that the heavier the GPU is utilized, the more power efficient the acceleration overall becomes.
GPU energy
We measured the average energy consumption per run across all the benchmarks to determine the cost of running the GPU for accelerating our ZK-Snark. The results are depicted in figure.8.
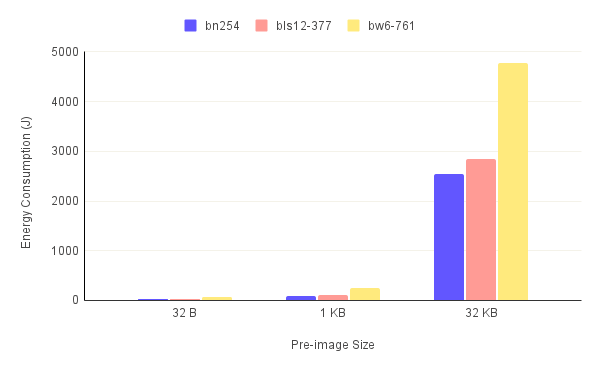
Clearly, more energy is used than the larger the pre-image, especially for the 32KB pre-image. This makes sense since those runs took significantly more time. However, most of this energy was consumed when the GPU was at idle and not when it was being utilized as made clear in the "GPU utilization" graphs. In fact, we measured the percentage of energy wasted,i.e the energy consumed when the GPU utilization is at 0%, in table.4 and it was anywhere from 30% to 60%. Our GPU idles at around 20 W. This shows that it's important to not only look at how power hungry is the GPU when being used, but also at how much power it consumes at idle especially for larger circuits. Assuming an electrical power cost of 0.20$/KWh, we also calculated the cost of GPU acceleration for a Million ZK-Snark runs. The results are in table.5
| Curve/Pre-image size | Total Energy (J) | Wasted Energy (J) | Wasted Energy (%) |
|---|---|---|---|
| bn254/32B | 0.065 | 0.021 | 32.20% |
| bls12-377/1KB | 0.315 | 0.161 | 51.13% |
| bw6-761/32KB | 14.278 | 8.658 | 60.67% |
| Pre-image size | Curve | Curve Total Energy (KWh) | Cost($) |
|---|---|---|---|
| 32B | bn254 | 5.78 | 1.16 |
| bls12-377 | 8.93 | 1.79 | |
| bw6-761 | 21.51 | 4.30 | |
| 1KB | bn254 | 22.67 | 4.53 |
| bls12-377 | 29.26 | 5.85 | |
| bw6-761 | 68.23 | 13.65 | |
| 32 KB | bn254 | 705.50 | 141.10 |
| bls12-377 | 793.00 | 158.60 | |
| bw6-761 | 1326.60 | 265.32 |
Limitations
This work is of course not without limitations. The main limitation is actually in the energy consumption calculation. The energy consumption is presented here as extra cost in return for better performance when using GPUs. The problem is that we are not measuring the CPU's energy consumption which of course increases when we are not using GPU as the CPU needs to perform all the computation on its own in that case. Therefore, the numbers are actually better for GPU acceleration than what they appear to be. We also measured power consumption using the Nvidia Management Library (NVML) and not directly from the wall. As a result, we did not account for the power loss at the power supply level. However, given the fact that power supplies today have a high efficiency, the difference should be minimal. We were also limited in terms of the hardware we had on hand. Indeed, running the benchmark on more GPUs from different generations and performance classes would have given us a better picture of what GPUs would work best for ZK-Snark acceleration. We also didn't try to over/underclock the GPUs because we didn't have direct access to the hardware and could not deal with any unexpected stability issues.
Summary
In this section, we go over the main findings in this benchmark.
Know your circuit
Apart from the circuit size, the other important factor that affects the GPU acceleration is the choice of the curve. Throughout the benchmark, bn254 and bls12-377 curves performed close to each other while the bw6-761 was more resource-intensive.
VRAM is a valuable resource
ZK-Snarks have shown in this benchmark that they consume large amounts of VRAM especially when dealing with a large circuit and using the bw6-761 curve. Therefore, it is crucial when choosing a GPU to make sure it has enough VRAM to run at least one instance of the ZK-Snark or more if multiple instances are to be ran concurrently. Gnark on Icicle needs at least 4GB to even run as shown in our tests.
Older GPUs are not suitable
While the older GPUs did produce worse results in our benchmark, this is a rather abnormal result and requires more testing and investigation to confirm this result. The problem could be with our own hardware. Nevertheless, this also ties closely with the previous point about VRAM. Having a lot of VRAM on GPUs (at least for consumer-grade GPUs) is a rather recent trend with cards up to the RTX 2000 series having a max of 11 GB VRAM. It is only with the RTX 3000 series that we start seeing GPUs with up to 24 GB of VRAM like the RTX 3090.
More utilization equals better efficiency
As previously discussed, the more the GPU is utilized the less energy is wasted not only during idle state but also during transitional states where the GPU is not being used but it consumes more power than idle levels. The problem is that achieving a close to 100% utilization is only possible with multiple concurrent ZK-Snark instances since the solution generation as well as parts of the proof generation are not GPU-accelerated. But, with multiple instances the CPU can become the bottleneck. Therefore, getting the most of the hardware when running multiple instances requires a balancing act between both the CPU and GPU performance.
Conclusion
In this benchmark, we took a look at the state-of-the-art of GPU acceleration for ZK-Snark. We chose Gnark as our ZK library and ran it with the Icicle library that accelerates ZK primitives using GPUs. Indeed, GPU acceleration did result in speed-up up to 500% for the full ZK-Snark. The results varied however depending on the size of the circuit and the curve used. This increase in performance did come also at the cost of hardware and energy consumption. The benchmark also showed that the GPU was not being fully utilized. This could improved upon if more of the proof generation or the solution generation could be accelerated using GPU although this does go against the main idea behind Icicle which is to accelerate ZK primitives not ZK-Snarks overall. We also note that this work can be improved in many ways. One of those ways is to measure the CPU's energy consumption to provide a more complete picture of the ZK-Snark power consumption. Some of the conclusions we came to in this work can also be changed with more features added to Icicle like for example multi-GPU support.
Notes on the user experience
As a part of our analysis, we also wanted to touch on the state of GPU acceleration for ZK-Snarks overall. While Gnark on Icicle was to the best of our knowledge the only open source solution for writing GPU accelerated ZK-Snarks, getting it to work was not easy. While the Icicle library had good documentation, the lack of a minimal working example made things much more difficult than they should have been. Luckily, the people at the Ingonyama-ZK's Discord server were extremely helpful and helped us get up and running. This goes to show that even Gnark on Icicle ,one of the best (if not he only) GPU accelerated ZK-Snark software out there still had some issues further attesting to the fact that the field is still relatively new and there are a lot of improvements before GPU accelerated ZK-Snarks are ready for deployment in production scenarios.


